Projects

We developed a web-based pharmaceutical inventory tracking application for local hospitals, pharmacies, and clinics.

The app was designed to enable real time communication between pharmacies and hospitals/clinics to ensure medications are distributed as effectively as possible between the institutions.

Learned basic Xcode IDE functionalities to create a GUI for a Magic 8 Ball themed app.

Coded in Swift to enable answers to be randomly selected from an array when the “shake” gesture is preformed (and when a “button pressed” action is performed on the GUI).

Installed the application on my physical device via Xcode for demonstration purposes.

Utilized the Java Swing GUI to create an information system that reads, writes, and updates employee information to and from .txt files.

Designed a GUI from scratch and made an easy to use layout for information input including input validation.

Coded methods for the information to read, save to (write), and update text files so that information was able to be kept up to date.

Utilized the Twitter Developer API to query tweets from @ESPNCFB to see how many mentions each college football team gets in tweets.

We did this by building a Java Web Application that requests the Twitter API to search @ESPNCFB’s twitter for team names.

We then display the number of mentions each football team got from @ESPNCFB and compare it to the teams win/loss record.

Using an Arduino Feather, a breadboard, and a temperature sensor, I coded the Arduino to intake the temperature and humidity of the room every 15 minutes. This data was then sent to a MySQL database via Wi-Fi and displayed the live temperature and humidity readings of the room.

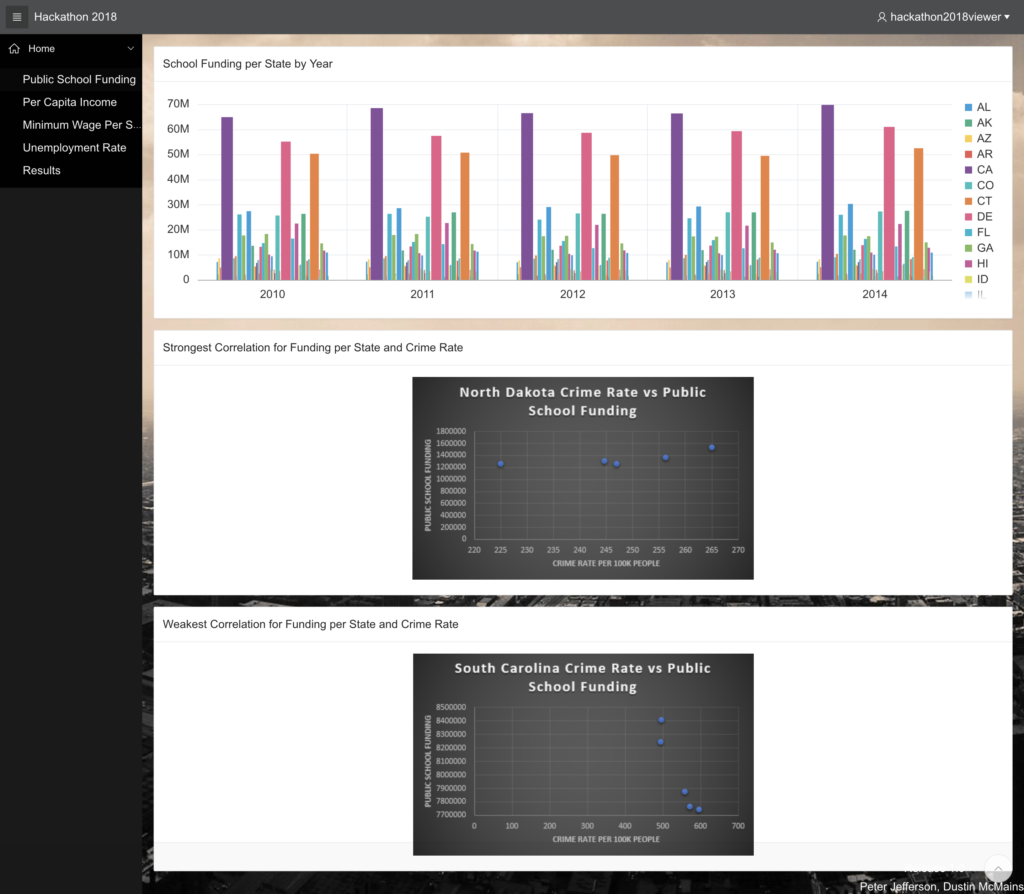
Developed a web application that shows a statistical analysis between crime rates and  public school funding, per capita income, minimum wage, and unemployment rates for every state in the U.S. between 2010 and 2014.

Gathered, cleaned and ran regression analyses on all data to find which factor had the highest correlation to an increase in crime rate.

Inserted the data into the Oracle Database to create multiple visualizations via Oracle APEX.

University of Iowa, April 2018

Developed a web application that can track trends in the United States Market for basketball shoes based on NBA player’s performance.

Built a ER diagram and a relational schema from scratch.

Collected both real data (NBA player performance statistics) and synthetic data (Customer Information) and inserted the data into the Oracle Database to manipulate into information.

Wrote SQL queries to display the relevant information such as total sales per player and region, and how they correlated with the players performance.